In late January, an atmospheric river tore through Southern California, bringing torrential rain and floods. Pictures of a swollen Los Angeles river dominated headlines, and the storm caused billions of dollars in damages. Now, another storm is hammering the already-waterlogged region, causing even more flooding and mudslides.
Experts say that this year’s El Niño is a likely catalyst of California’s torrential rains, but climate change is certainly making storms like these more severe. Recent climate models predict that precipitation will become more intense, but less frequent, along the West Coast in the next few decades, and Southern California will likely experience more disastrous floods.
“We’re definitely seeing precipitation happening in much more intense bursts. We’re seeing 100-year flood events happening much more frequently than every 100 years,” said Meg Mills-Novoa, an assistant professor in the Department of Environmental Science, Policy and Management at the University of California, Berkeley. “We know — across the board in the West — we’re looking at greater drought risk, greater extreme temperatures. We know those things are happening now.”
According to risk data collected by the Federal Emergency Management Agency and analyzed by High Country News, the coastal Pacific Northwest, including many parts of Oregon, are at high risk of flooding, with coastal cities being more vulnerable to natural disasters overall. Meanwhile, across the West, communities are at increased risk of riverine flooding.
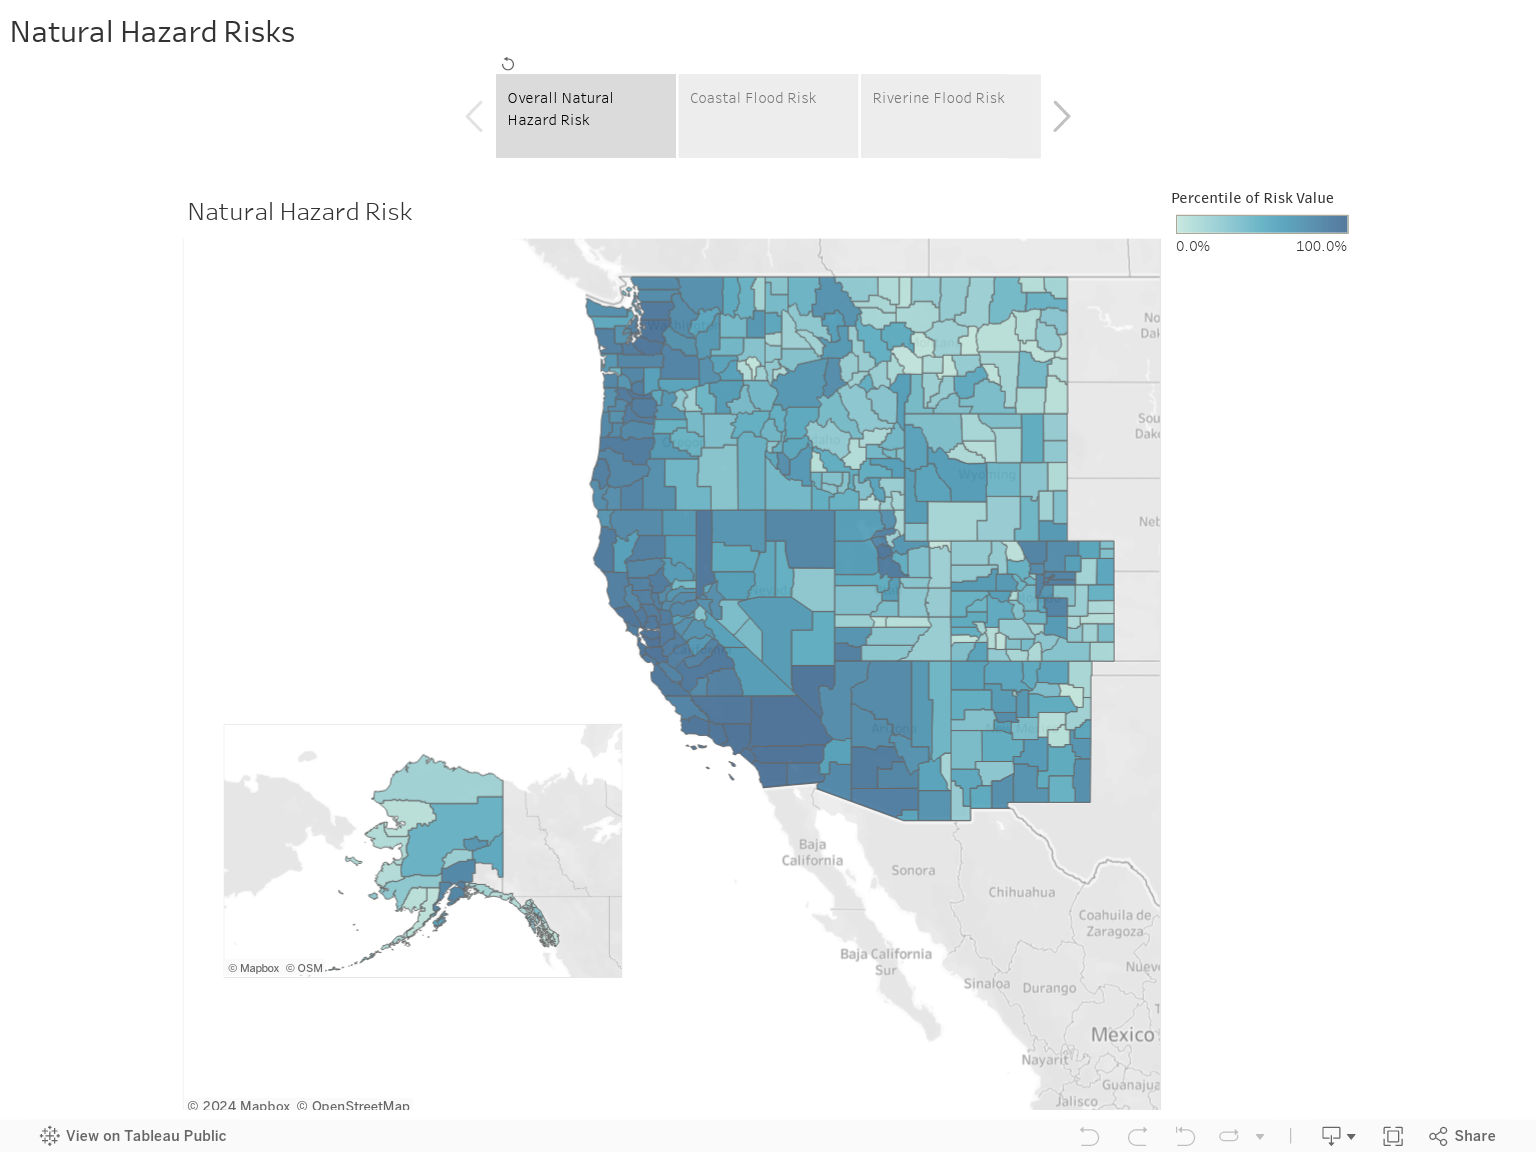
A map of natural hazard risk, coastal flooding risk and riverine flooding risk across the West at the county level. These maps were generated using FEMA National Risk Index data and Census data from 2022 American Community Survey data. To interpret FEMA data, please see the following data disclaimer.
Nationwide, floods disproportionately impact poor and rural areas and communities of color, as well as unhoused people. The legacy of redlining means that predominantly Black, Indigenous and Latino neighborhoods and communities are often less prepared for emergencies than predominantly white ones and are less likely to bounce back after a disaster, Campbell said.
FEMA’s data shows that, in the West, people of color face a higher risk of natural hazards overall. People who identify as American Indian and Alaska Native are at greater risk than other racial groups for disasters likely to be exacerbated by climate change, including coastal and river flooding, drought, wildfires and landslides. Meanwhile, Hispanic or Latino individuals are at higher risk of floods, droughts and extreme heat than other ethnic groups.
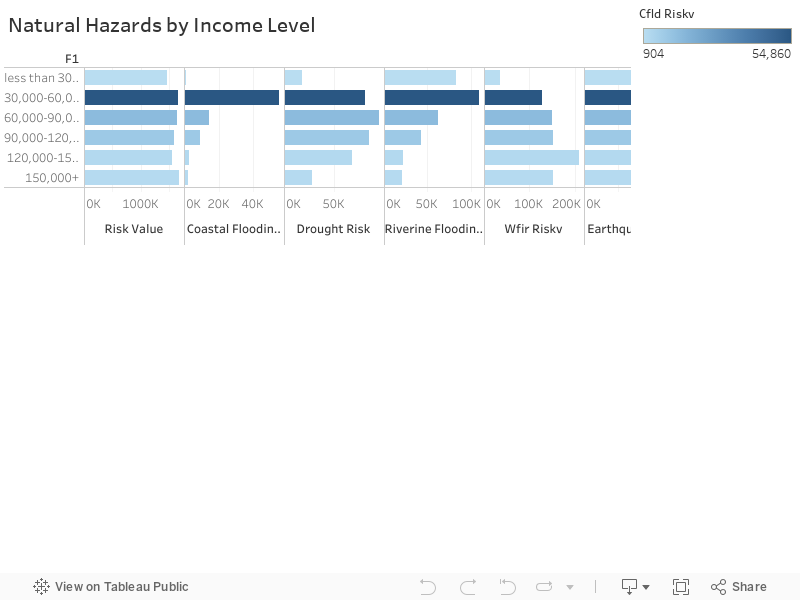
Income is also a factor. According to FEMA, white, low-income neighborhoods are currently at greater risk of coastal flooding and riverine flooding, though climate models project that, in the future, flooding will disproportionately impact people of color.

“There’s these systems of oppression that have existed and continue to evolve over time, things like racism, sexism, colonialism that have led certain populations to be at a higher risk to hazards and disasters,” explained Nnenia Campbell, a research associate with the Natural Hazards Center at the University of Colorado Boulder.
“But just because you belong to one of these populations doesn’t necessarily mean that you’re at risk,” Campbell added. Communities of color aren’t inherently more vulnerable; rather, their vulnerability comes from systemic inequities.
With the exception of earthquakes, most hazards disproportionately impact low or middle-income households. Mills-Novoa pointed out that rural communities are especially burdened by natural hazards and disasters because they’re so often overlooked. Other vulnerable communities, such as migrant workers, are not featured in the census or National Risk Index. When using tools like the National Risk Index, Mills-Novoa said, “we need to acknowledge the limitations and the folks who are not represented there.”
“People’s vulnerability is so much created by our socioeconomic systems and cultural values,” she added. “That’s why we refer to them as ‘unnatural hazards.’”
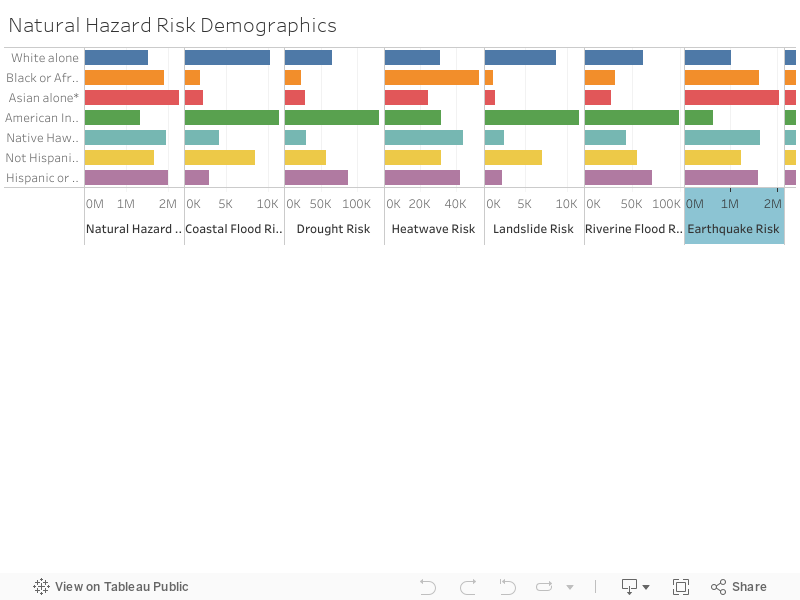
The demographics of risk for several natural hazards across the West at the census tract level. These maps were generated using the FEMA National Risk Index data and 2022 census data from the 2022 American Community Survey.
FEMA’s National Risk Index considers how expensive a community’s recovery from a natural disaster is likely to be, as well as its social vulnerability and community resilience. Community resilience is a measure of a community’s ability to bounce back after a disaster, while social vulnerability measures how likely a community is to experience negative impacts from a disaster, based on race, wealth, age, gender makeup and other factors. These risk ratings are intended for planners and emergency managers at the local, regional, state and federal levels. FEMA runs the National Flood Insurance Program, the nation’s largest flood insurance program, which uses risk assessments to set insurance rates.
FEMA’s data does not yet account for potential climate impacts. Currently, the agency relies on historical information to determine a county’s expected annual loss.
And tools like the National Risk Index are just the starting point for assessing risk, Campbell said; clearly, more work needs to be done. Census tracts, which FEMA uses to compute the National Risk Index, are often diverse, so more granular risk assessments are needed to identify which communities require resources. Then, it’s important to adequately communicate risk, particularly to vulnerable populations. The best way to do this is through trusted sources, Campbell said: “It’s important to talk to community leaders, to go physically to different areas and try to understand what we’re not getting from those large aggregate datasets.”
Average median household income versus average natural hazard risk in Western states at the census tract level. These maps were generated using the FEMA National Risk Index data and 2022 census data from the American Community Survey Estimates.
Natalia Mesa is an editorial fellow for High Country News based in Seattle, Washington, and reporting on science, and environmental and social justice. Email her at natalia.mesa@hcn.org or submit a letter to the editor. See our letters to the editor policy.
![]()
